
Section 04 · Watching the Climb
04The Coaching Dashboard
The Coaching Dashboard is where a sales leader spends their morning. It rolls up every rep's scores, trends, and pipeline into one view, and lets you drill into any individual. This section reads the dashboard panel by panel — and connects what you see to the coaching questions from the Sales Executive and Account Manager guides.
Opening the dashboard
Click Dashboards. What you see is scoped to your role: a manager sees their team, an owner or admin sees everyone. The subtitle tells you the scope and how many reps are included.
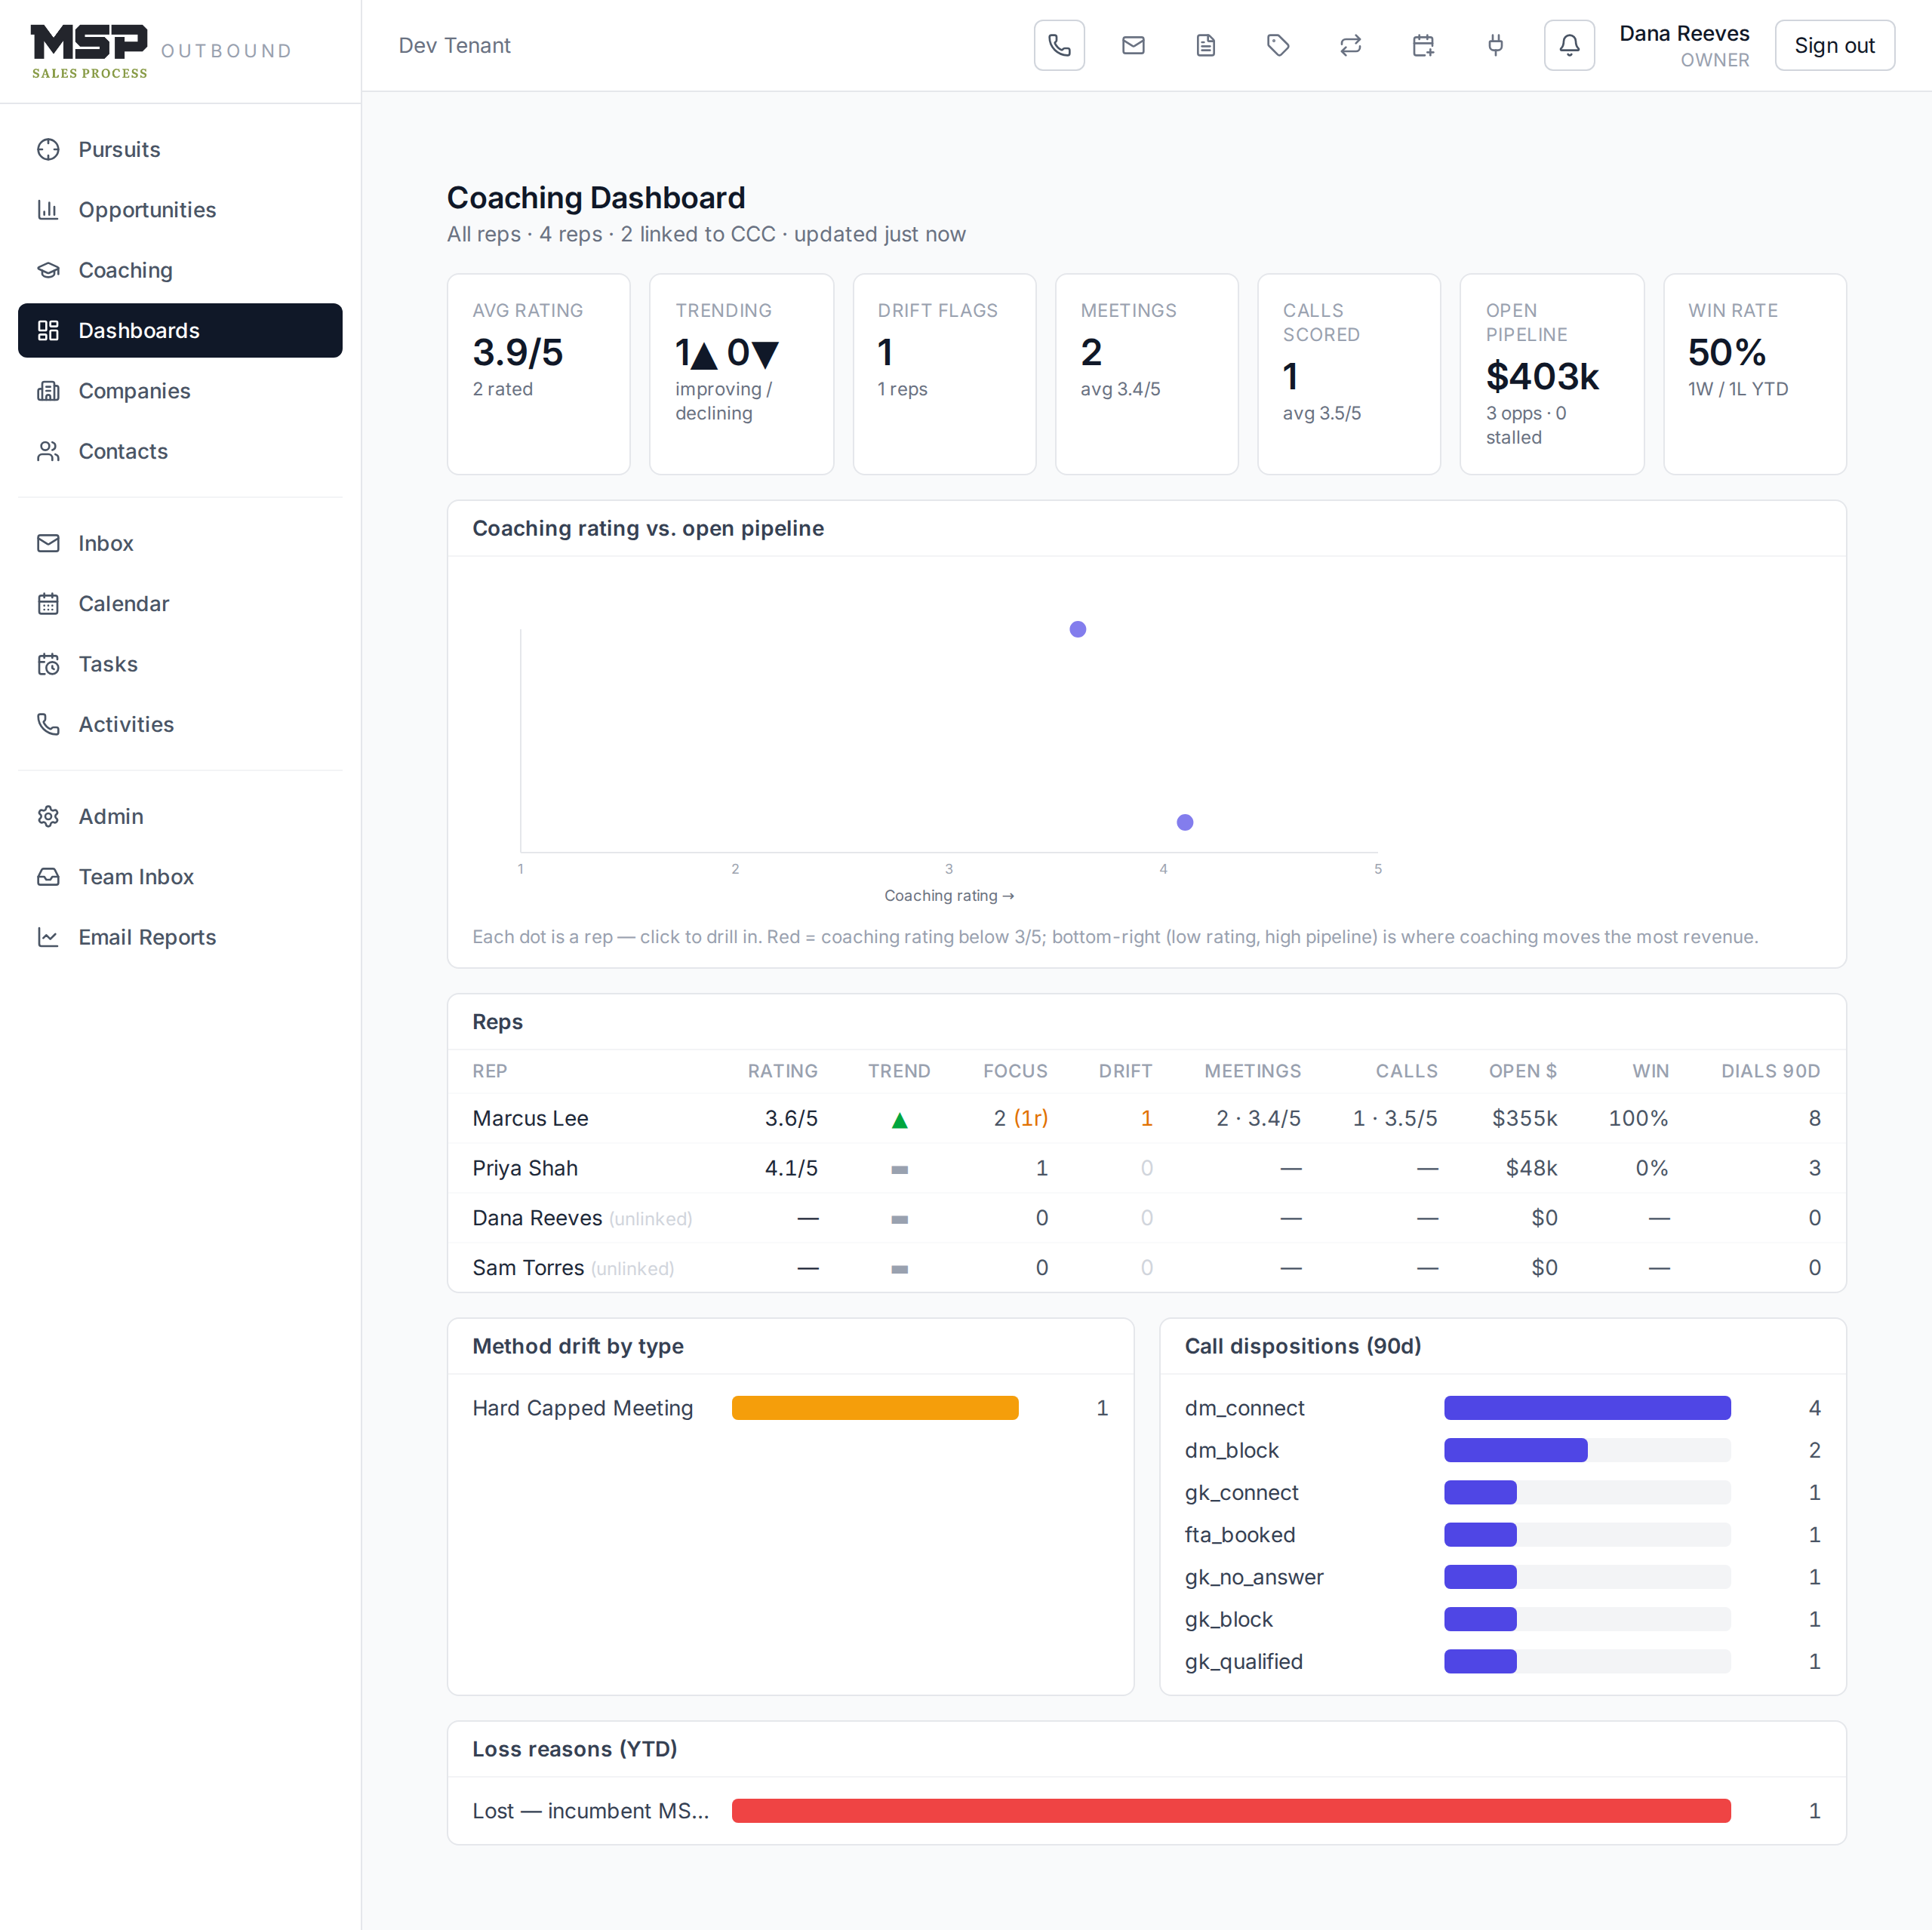
Figure 4.1The Coaching Dashboard. Tiles up top, the rating-vs-pipeline map in the middle, the reps table below.
The top-line tiles
| Tile | What it tells you |
|---|---|
| Avg rating | The team's average coaching score, and how many reps are rated. |
| Trending | How many reps are improving versus declining. |
| Drift flags | How many reps have an active bad-habit pattern. |
| Meetings / Calls scored | Coaching volume and the average score on each. |
| Open pipeline | Total open value and how many deals are stalled. |
| Win rate | Won versus lost, year to date. |
The rating-vs-pipeline map
The scatter plots each rep by coaching rating (left to right) against open pipeline (bottom to top). It answers a question every leader asks: who is carrying a lot of pipeline on shaky fundamentals? A rep low on rating but high on pipeline (bottom-right) is your highest-risk coaching priority — a lot riding on skills that need work.
The reps table and the drill-in
Below the map, every rep is a row — rating, trend, focus area, drift, meeting and call scores, open pipeline, win rate, and 90-day dials. Worst-rated first, so your attention lands where it's needed. Click any rep to open a slide-in panel with their full picture: drift flags, focus areas, category ratings, skill dimensions, and recent meetings.
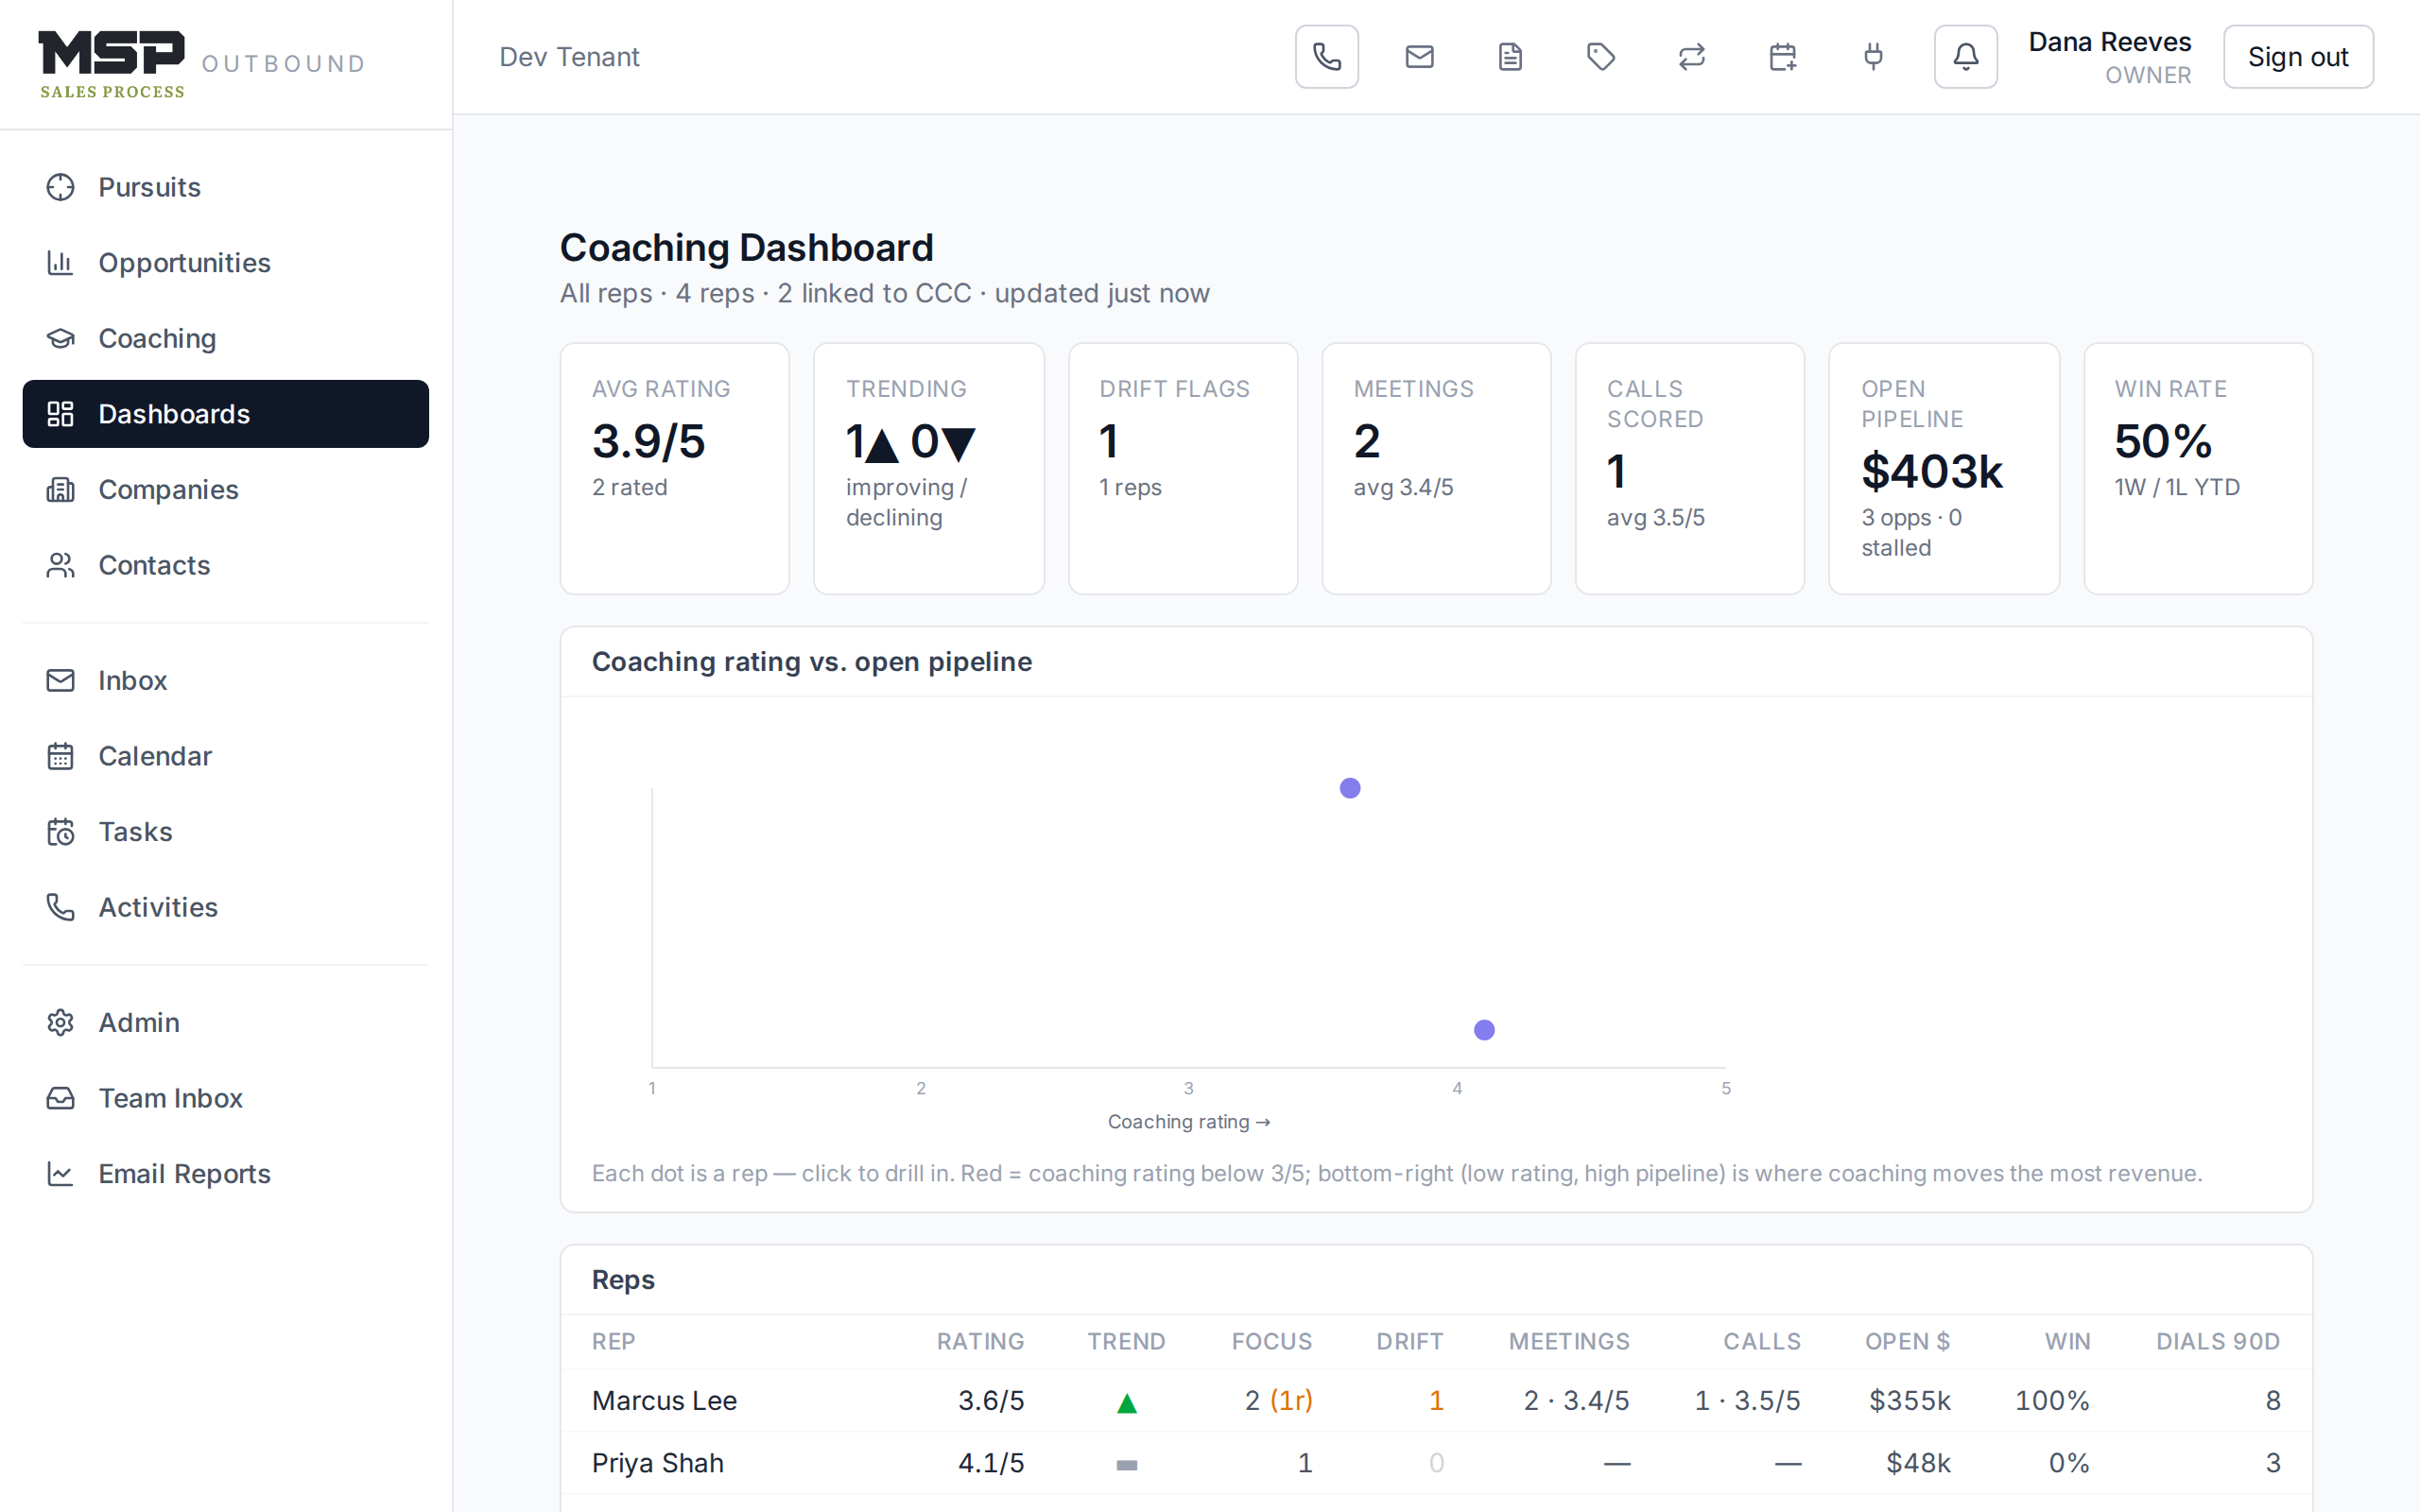
Figure 4.2The rep drill-in. Everything you need for a focused, evidence-based 1:1.
Coach by stage and by skill
The method's core coaching principle is that a stuck deal is usually a skill problem showing up in a stage. The dashboard is built to help you find which. Use this diagnostic:
Isn't getting FTAs
- Weak qualification
- Weak gatekeeper strategy
- Generic messaging
- Poor objection handling
- Weak call discipline
Gets FTAs, weak opportunities
- Weak discovery
- Poor active listening
- Weak pain-thread work
- Weak stakeholder discovery
- Poor next-step control
Gets opportunities, weak closes
- Weak value framing
- Discomfort discussing money
- Weak negotiation
- Weak commitment language
- Can't tell polite interest from real intent
Where the dashboard points you
- Dials & FTA rate → the first column
- Meeting scores & drift → the second
- Win rate & loss reasons → the third
The method in the tool
Read the numbers as symptoms, then coach the skill underneath. A rep with strong dials but few FTAs doesn't need "make more calls" — they need qualification or objection work. The rep's own coaching page (Rep Guide §13) names the exact focus and the lesson that helps; your job is to hold them to it.
The bottom line
Symptoms on the dashboard, skills in the 1:1.
Start with the worst-rated reps carrying the most pipeline, drill into their evidence, and coach the skill the stage is exposing. That's the whole loop, and it starts here every morning.